

What Is Snowflake Data Model?
The Snowflake Data Model is a way of organizing data in Snowflake Data Cloud using fact tables and dimension tables so that analytics, reporting, and business intelligence (BI) queries run faster, cleaner, and more accurately.
Introduction to Snowflake Data Model
When companies store large volumes of data in Snowflake, raw data alone is not useful. To get insights like:
- Sales trends
- Customer behavior
- Revenue growth
- Marketing performance
They need a logical structure. That structure is called a data model.
The Snowflake data model helps organizations:
- Organize data logically
- Reduce query complexity
- Improve performance
- Make data easy for analysts and BI tools to understand
Snowflake mainly supports dimensional data modeling, which is widely used in analytics and data warehousing.
Why Data Modeling Is Important in Snowflake
Data modeling is one of the most critical foundations of working with Snowflake. Even though Snowflake can handle large volumes of data, how you structure that data directly impacts performance, cost, and long-term success.
A well-designed data model helps Snowflake do what it does best: fast, scalable, and cost-efficient analytics. Without proper data modeling, queries become slow, costs increase, and reports lose reliability—no matter how powerful the platform is.
Benefits for Businesses
For organizations using Snowflake for analytics, BI, and decision-making, data modeling is not optional—it’s a competitive advantage.
Faster Analytics Queries
A clean data model reduces complex joins and unnecessary data scans. Snowflake can process queries faster when fact and dimension tables are structured correctly.
Why this matters:
- Dashboards load quickly
- Analysts get answers in seconds, not minutes
- Business decisions happen faster
This is especially important for companies running real-time or near-real-time analytics across multiple teams.
Lower Compute Cost
Snowflake charges based on compute usage. Poor data modeling forces queries to scan more data than needed, which directly increases costs.
With proper data modeling:
- Queries scan fewer rows
- Warehouses consume less compute
- Monthly Snowflake bills stay under control
Better Data Consistency
A strong data model creates a single source of truth. Metrics like revenue, customers, or conversions are defined once and used everywhere.
This prevents:
- Conflicting numbers across reports
- Confusion between teams
- Loss of trust in data
Executives and stakeholders can confidently rely on dashboards built on a well-modeled Snowflake warehouse.
Scalable Reporting
As data volume and users grow, reporting can break if the model isn’t scalable. Snowflake data modeling ensures reports continue to perform well even as the business expands.
Key advantages:
- Easy to add new data sources
- Supports more users without slowdown
- Works smoothly with BI tools like Tableau, Power BI, and Looker
Benefits for Careers
Data modeling in Snowflake isn’t just good for companies—it’s a career accelerator for professionals working in data and analytics.
Required Skill for Snowflake Data Engineers
Most Snowflake roles expect strong knowledge of data modeling concepts such as:
- Fact and dimension tables
- Star and snowflake schemas
- Analytical query optimization
If you want to work as a Snowflake Data Engineer or Analytics Engineer, data modeling is a core skill—not a nice-to-have.
Used in Real Enterprise Projects
In real-world enterprise environments, data modeling is used every day to:
- Build enterprise data warehouses
- Support executive dashboards
- Enable advanced analytics and AI workloads

Types of Data Models Used in Snowflake
Snowflake supports several data modeling techniques, each designed to solve different business and technical challenges. Selecting the right data model helps improve query speed, scalability, cost control, and reporting efficiency.
Snowflake Data Model Types
Data Model Type | Description | Best Use Case |
Star Schema | One fact table connected to flat, denormalized dimensions | BI reports and dashboards |
Snowflake Schema | Dimensions normalized into multiple related tables | Complex or hierarchical dimensions |
Third Normal Form (3NF) | Fully normalized transactional-style structure | Raw data and staging layers |
Data Vault | Hub, Link, and Satellite-based modeling approach | Large-scale enterprise data platforms |
1. Star Schema in Snowflake
The Star Schema is the most popular data model for analytics and reporting in Snowflake. It is simple, fast, and easy for business users to understand.
How Star Schema Is Structured
- A single fact table stores measurable data such as sales or revenue
- Multiple dimension tables store descriptive data like date, product, or customer
- The structure visually resembles a star
Why Star Schema Performs Well in Snowflake
- Requires fewer joins, improving query speed
- Optimized for Snowflake’s columnar storage
- Works smoothly with BI tools like Tableau and Power BI
Ideal Use Cases
- Business dashboards
- Performance tracking
- Executive and operational reporting
2. Snowflake Schema in Snowflake
The Snowflake Schema builds on the star schema by breaking large dimensions into smaller, related tables.
How Snowflake Schema Works
- The fact table remains at the center
- Dimension tables are split into sub-dimensions
- Reduces repeated data storage
Key Benefits
- Saves storage space
- Maintains better data consistency
- Supports complex hierarchies like geography or product categories
Things to Consider
- Requires more joins than star schema
- Queries may be slightly more complex
Best Use Cases
- Product category hierarchies
- Organizational structures
- Large dimensions with many attributes
3. Third Normal Form (3NF) in Snowflake
Third Normal Form (3NF) is a highly structured and normalized data model. In Snowflake, it is mainly used during data ingestion and preparation, not for analytics.
How 3NF Is Designed
- Data is split into many small tables
- Each table stores a single type of information
- Reduces redundancy and improves accuracy
Why 3NF Is Used in Snowflake
- Preserves source-system structure
- Ideal for raw and staging layers
- Ensures clean and reliable data loading
When to Avoid 3NF
- Not suitable for BI queries
- Requires many joins, which slows reporting
4. Data Vault Modeling in Snowflake
Data Vault is a scalable and flexible data modeling approach designed for modern enterprise data warehouses.
Core Components of Data Vault
- Hubs store unique business keys
- Links define relationships between business entities
- Satellites hold descriptive attributes and historical changes
Why Data Vault Works Well with Snowflake
- Handles large volumes of data efficiently
- Adapts easily to changing source systems
- Maintains full historical tracking
- Supports ELT-based pipelines
Best Use Cases
- Enterprise-level data warehouses
- Integrating data from multiple systems
- Long-term historical analysis
Snowflake Schema vs Star Schema
When designing a data model in Snowflake, one of the most common (and high-impact) decisions is choosing between a Star Schema and a Snowflake Schema.
Both are dimensional modeling techniques used in data warehousing—but they serve different use cases, skill levels, and performance needs. Let’s break it down in a simple, decision-friendly way.
Star Schema vs Snowflake Schema
Feature | Star Schema | Snowflake Schema |
Complexity | Simple and straightforward | Moderate (more structured) |
Table Structure | Fact table + denormalized dimensions | Fact table + normalized dimensions |
Query Performance | Faster (fewer joins) | Slightly slower (more joins) |
Storage Usage | Uses more storage | Uses less storage |
Maintenance | Easy to manage | Medium complexity |
Best For | BI tools, dashboards, beginners | Complex dimensions, large enterprises |
Learning Curve | Low | Medium |
Use in Snowflake | Very common | Used when optimization is needed |
Core Components of a Snowflake Data Model
The Snowflake data model is built on two fundamental building blocks: fact tables and dimension tables. Together, they organize data in a way that makes analytics faster, cleaner, and easier to understand for both humans and BI tools.
This section explains each component in a simple, practical way—perfect for beginners, job seekers, and data professionals alike.
Fact Tables
What Is a Fact Table?
A fact table stores measurable, quantitative business data. These are the numbers that organizations analyze to track performance, growth, and trends.
Think of a fact table as the “what happened” part of your data.
What Fact Tables Store
Fact tables typically include:
- Metrics such as:
- Sales amount
- Revenue
- Profit
- Quantity sold
- Foreign keys that link to dimension tables (customer, product, date, etc.)
Key Characteristics of Fact Tables
- Contain large volumes of data
- Mostly numeric values
- Optimized for aggregations (SUM, AVG, COUNT)
- Act as the center of analytical queries
Simple Example
A sales fact table might include:
- Order ID
- Product ID
- Customer ID
- Date ID
- Sales amount
Dimension Tables
What Is a Dimension Table?
A dimension table provides descriptive context to the numbers stored in fact tables.
If fact tables answer “how much”, dimension tables explain “who, what, where, and when.”
Common Dimension Table Examples
- Customer – name, location, segment
- Product – category, brand, price
- Date – day, month, quarter, year
- Region – country, state, city
Key Characteristics of Dimension Tables
- Contain descriptive attributes
- Have fewer rows than fact tables
- Easy for humans to read and understand
- Used for filtering, grouping, and labeling reports
Snowflake Data Model Example
To understand the Snowflake Data Model clearly, let’s walk through a real-world, easy-to-grasp example. This will help students, job seekers, and business users quickly see how Snowflake modeling works in practice.
Example Scenario: E-commerce Sales Analytics
Imagine you own an e-commerce business and want to analyze your data.
- Daily and monthly sales
- Best-selling products
- Customer purchasing behavior
- Revenue trends by region and time
To answer these questions efficiently in Snowflake, you design a Snowflake Data Model using fact and dimension tables.
This structure ensures:
- Fast analytical queries
- Clean, organized data
- Scalable reporting as data grows
Fact Table: Fact_Sales
The Fact_Sales table stores measurable business data (metrics).
It acts as the central table in the Snowflake Data Model.
Key Columns in Fact_Sales
- sales_id
- order_id
- customer_id (FK)
- product_id (FK)
- date_id (FK)
- quantity_sold
- total_sales_amount
- discount_amount
Purpose:
Stores numerical values that businesses analyze, such as revenue and quantity.
Dimension Table: Dim_Customer
The Dim_Customer table stores descriptive information about customers.
Key Columns
- customer_id (PK)
- customer_name
- city
- state
- country
- customer_segment
Purpose:
Helps analyze sales by customer location, segment, or behavior.
Dimension Table: Dim_Product
The Dim_Product table contains details about products sold on the platform.
Key Columns
- product_id (PK)
- product_name
- category_id (FK)
- brand
- price
Purpose:
Supports analysis like top-selling products, category-wise revenue, and brand performance.
Dimension Table: Dim_Date
The Dim_Date table makes time-based analysis easier and faster.
Key Columns
- date_id (PK)
- full_date
- day
- month
- quarter
- year
- is_weekend
Purpose:
Allows trend analysis by day, month, quarter, or year without complex date functions.
How This Becomes a Snowflake Schema
In a Snowflake Data Model, some dimensions can be further normalized.
Example:
- Dim_Product → Dim_Category
- Dim_Customer → Dim_Region
This creates multiple related dimension tables, forming a snowflake-like structure.
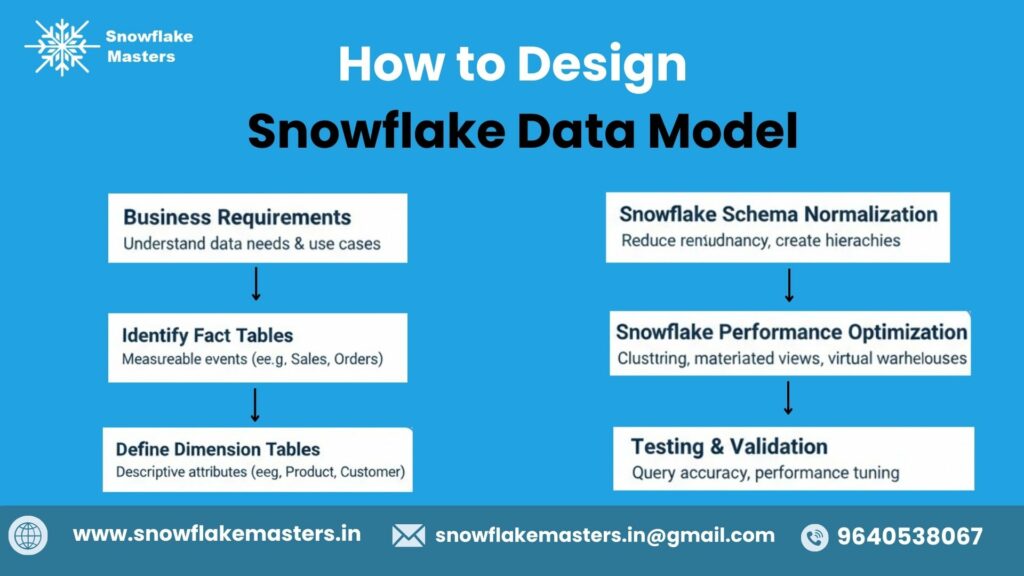
How to Design a Snowflake Data Model
Designing a Snowflake data model is not just about creating tables—it’s about translating business questions into a scalable analytical structure.
Step 1: Understand Business Requirements
Before writing a single SQL statement, you must understand why the data model is needed.
Ask the right business questions:
- What KPIs need to be tracked? (Revenue, churn, orders, conversions, etc.)
- Who will use the data? (Analysts, marketers, executives, data scientists)
- How often will reports be refreshed? (Real-time, daily, weekly)
Why this matters
- Prevents rework and poor performance later
- Ensures the model answers real business questions
- Aligns data teams with stakeholders
Step 2: Identify Facts and Dimensions
This step forms the foundation of dimensional modeling in Snowflake.
Fact Tables (What happened?)
- Contain measurable data (sales amount, quantity, revenue)
- Store numeric values used in calculations
Dimension Tables (Who, what, when, where?)
- Provide descriptive context (customer, product, date, location)
Example:
- Fact table: fact_sales
- Dimension tables: dim_customer, dim_product, dim_date, dim_region
Best Practice
- Keep fact tables lean and numeric
- Use dimensions for filtering, grouping, and slicing data
Step 3: Choose the Right Schema Type (Star vs Snowflake)
Snowflake supports both Star Schema and Snowflake Schema, but the choice impacts performance and complexity.
Schema Type | When to Use | Pros | Cons |
Star Schema | Simple reporting & BI tools | Faster queries, easier joins | Data duplication |
Snowflake Schema | Large, complex dimensions | Less redundancy, better normalization | More joins |
Expert Recommendation
- Start with Star Schema for BI-heavy use cases
- Move to Snowflake Schema when dimensions become large or hierarchical
Step 4: Define the Grain of the Fact Table
Grain = the level of detail stored in the fact table
This is one of the most critical steps in Snowflake data modeling.
Examples of grain:
- One row per order
- One row per order item
- One row per customer per day
Why grain matters
- Determines query flexibility
- Prevents incorrect aggregations
- Controls data volume and cost
Rule of Thumb
Always define the grain before adding columns to a fact table.
Step 5: Create Relationships Between Tables
Now, connect facts and dimensions using primary and foreign keys.
Key principles:
- Fact tables reference dimension tables via surrogate keys
- Avoid many-to-many relationships in facts
- Maintain consistent naming conventions
Snowflake Advantage
- Snowflake does not enforce foreign key constraints, improving load speed
- Logical relationships are still essential for BI tools and analytics
Tip for BI Compatibility
Ensure relationships are clearly defined so tools like Power BI, Tableau, and Looker can auto-detect joins.
Step 6: Optimize the Model for Query Performance
Snowflake is powerful, but good modeling multiplies performance.
Optimization techniques:
- Use appropriate clustering keys for large fact tables
- Minimize unnecessary joins
- Avoid over-normalization
- Use materialized views for frequent aggregations
Cost & Performance Balance
- Well-designed models reduce compute usage
- Faster queries = lower Snowflake credits consumption
Step 7: Validate the Model Using BI Tools
Before production rollout, validate your model with real users and tools.
Validation checklist:
- Can users answer business questions easily?
- Are dashboards fast and accurate?
- Do aggregations match expected results?
Recommended BI Tools
- Power BI
- Tableau
- Looker
- Amazon QuickSight
Best Practices for Snowflake Data Modeling
Designing an efficient data model in Snowflake is critical for fast queries, lower costs, and reliable analytics. Snowflake’s cloud-native architecture works best when your data model is simple, scalable, and purpose-built for analytics.
Below are the most effective best practices used by data engineers and analytics teams worldwide.
Use Star Schema for Analytics
Star schema is the most recommended modeling approach for Snowflake analytics workloads.
In a star schema:
- A fact table stores measurable business data (sales, revenue, clicks)
- Dimension tables store descriptive details (customer, product, date, region)
This structure reduces query complexity and improves performance.
Why star schema works best in Snowflake:
- Fewer joins mean faster query execution
- BI tools work seamlessly with star schemas
- Easier for analysts and business users to understand
Example use cases:
- Sales reporting dashboards
- Marketing performance analysis
- Financial and operational analytics
Avoid Over-Normalization
Over-normalization breaks data into too many small tables, which increases join complexity and slows down analytical queries.
While normalization is useful in transactional systems, Snowflake is designed for analytical workloads.
Best approach:
- Keep dimensions slightly denormalized
- Combine related attributes into a single dimension table
- Reduce unnecessary joins
Benefits:
- Faster query performance
- Simpler SQL queries
- Better experience for BI and reporting tools
Leverage Snowflake’s Compute Scalability
Snowflake separates storage and compute, which allows you to scale compute power independently based on workload demand.
How to model with scalability in mind:
- Design fact tables to handle large data volumes
- Expect growth in historical and real-time data
- Optimize models for parallel processing
Key advantages:
- Run heavy queries without impacting other users
- Scale warehouses up or down as needed
- Support multiple analytics teams simultaneously
Partition Using Date Dimensions
Date-based partitioning is essential for managing large fact tables and improving query performance.
In Snowflake, this is typically achieved through:
- A date dimension table
- Consistent use of date keys in fact tables
Why date partitioning matters:
- Faster filtering for time-based queries
- Better performance for historical analysis
- Efficient handling of incremental data loads
Best practices:
- Use standard date keys (YYYYMMDD format)
- Include year, month, quarter, and week attributes
- Filter queries using date columns whenever possible
Document Your Data Model
A data model is only effective if people understand how to use it.
Clear documentation ensures consistency, faster onboarding, and fewer errors.
What to document:
- Table purpose and grain
- Column definitions and business meaning
- Relationships between fact and dimension tables
- Common use cases and sample queries
Tools you can use:
- Data catalogs
- Wiki pages or internal documentation tools
- Comments directly in Snowflake tables
Snowflake Data Modeling Career Roadmap
If you want a clear, job-ready path to become a Snowflake Data Modeling expert, this roadmap removes confusion and guesswork.
It’s designed for students, working professionals, and career switchers—step by step, week by week.
This section also works as a natural monetization hook for a structured course like SnowflakeMasters.
Clear Learning Path – From Beginner to Job-Ready
Instead of jumping randomly between tutorials, follow this 4-phase roadmap. Each phase builds skills that are directly tested in interviews and used in real projects.
Phase 1 – Fundamentals (Week 1–2)
Focus: Build a strong foundation before touching Snowflake-specific features.
What You’ll Learn
1. Data Warehousing Basics
- What a data warehouse is and why companies use it
- OLTP vs OLAP (explained with real examples)
- ETL vs ELT and why Snowflake prefers ELT
- Role of data modeling in analytics
2. Dimensional Modeling Concepts
- Fact tables vs dimension tables
- Star schema vs snowflake schema
- Slowly Changing Dimensions (SCD Type 1, 2)
- Grain definition (a critical interview topic)
3. SQL Fundamentals
- SELECT, JOIN, GROUP BY, HAVING
- Window functions (ROW_NUMBER, RANK)
- Aggregations used in reporting
- Writing clean, readable SQL for analytics
Phase 2 – Snowflake Core (Week 3–4)
Focus: Learn how Snowflake actually works under the hood.
What You’ll Learn
1. Snowflake Architecture
- Virtual warehouses (compute)
- Databases, schemas, and storage
- Separation of compute and storage
- How Snowflake scales automatically
2. Schema Design in Snowflake
- Naming conventions (enterprise-level)
- Database & schema strategy
- Handling multi-environment setups (DEV / QA / PROD)
- Security basics (roles & access)
3. Fact & Dimension Modeling in Snowflake
- Designing star schemas in Snowflake
- Handling large fact tables efficiently
- Choosing correct data types
- Modeling for BI tools (Power BI, Tableau)
Phase 3 – Advanced Modeling (Week 5–6)
Focus: Think like a senior data engineer or analytics architect.
What You’ll Learn
1. Performance Optimization
- Clustering Keys in Snowflake: When to Use and When Not to for Performance Optimization
- Query pruning and partitioning logic
- Warehouse sizing strategies
- Reducing query latency for dashboards
2. Cost Optimization
- Controlling compute costs
- Auto-suspend & auto-resume best practices
- Storage optimization strategies
- Identifying expensive queries
3. Real-World Case Studies
- E-commerce sales data model
- Marketing analytics model
- Finance reporting model
- Handling late-arriving data
Phase 4 – Tools & Hands-On Projects
Focus: Become job-ready with real tools companies actually use.
Tools Covered
Snowflake
- Creating databases & schemas
- Loading data
- Optimizing models for analytics
dbt (Data Build Tool)
- Transforming data using ELT
- Writing modular models
- Testing & documentation
- Version control-ready workflows
Power BI / Tableau
- Connecting Snowflake to BI tools
- Designing reporting-friendly models
- Optimizing for dashboards & KPIs
AWS / Azure Basics
- Cloud data ecosystem understanding
- Where Snowflake fits in cloud architecture
- Common enterprise setups
Why Follow a Structured Learning Program?
Self-learning often leads to:
- Gaps in fundamentals
- Poor modeling habits
- Interview rejections despite “experience”
A structured roadmap ensures:
- Logical skill progression
- Industry-aligned best practices
- Faster job readiness
Who Should Learn Snowflake Data Modeling?
Snowflake data modeling is not just for hardcore engineers. It’s a must-have skill for anyone working with data, analytics, or business intelligence in today’s cloud-first world.
Students & Freshers
If you are a student, recent graduate, or career switcher, learning Snowflake data modeling gives you a strong head start.
Why it matters for you:
- Builds a solid foundation in dimensional modeling (facts & dimensions)
- Helps you understand real-world analytics systems
- Makes your resume job-ready for data roles
- Increases chances of landing entry-level data analyst or engineer jobs.
Data Analysts
For data analysts, Snowflake data modeling is the key to faster queries and accurate insights.
How it helps data analysts:
- Enables clean, well-structured datasets for analysis
- Improves query performance on large data volumes
- Makes dashboards and reports more reliable
- Reduces dependency on data engineers for simple data changes
Real-world impact:
Well-modeled data = faster insights + better business decisions
Data Engineers
Data engineers are the primary architects of Snowflake data models.
Why Snowflake data modeling is critical for engineers:
- Design scalable fact and dimension tables
- Optimize storage and compute usage in Snowflake
- Support ELT pipelines efficiently
- Ensure data consistency across analytics and BI tools
Key advantage:
Good data modeling reduces technical debt and long-term maintenance costs.
BI Developers
BI developers rely heavily on well-designed Snowflake data models for reporting and visualization.
Benefits for BI developers:
- Ensures consistent KPIs and metrics
- Improves report performance with optimized schemas
- Reduces confusion caused by poorly structured data
Outcome:
Better models = faster dashboards + happier stakeholders
Business Intelligence Teams
Entire BI teams benefit when Snowflake data modeling is done correctly.
Why BI teams should learn it:
- Aligns data structure with business goals
- Improves cross-team collaboration
- Ensures single source of truth
- Supports enterprise-level analytics and reporting
Business value:
Strong data models lead to data-driven decisions across the organization.
Conclusion : What Is Snowflake Data Model?
The Snowflake data model is a powerful and flexible way to organize data for modern analytics. By structuring data into fact and dimension tables, it enables faster queries, cleaner reporting, and scalable business intelligence across industries.
Whether you are a student learning data modeling, a job seeker preparing for Snowflake interviews, or a business owner building data-driven strategies, understanding the Snowflake data model gives you a strong competitive advantage. Its ability to handle large datasets, support real-time analytics, and integrate seamlessly with BI tools makes it a preferred choice for organizations worldwide.
Frequently Asked Questions
1. What is Snowflake data model in simple terms?
A Snowflake data model organizes data using fact and normalized dimension tables for efficient analytics.
2. What schema is used in Snowflake?
Snowflake supports both Star and Snowflake schemas, with normalized dimensions for large datasets.
3. Is Snowflake schema better than star schema?
Snowflake schema is more storage-efficient, while Star schema offers faster query performance.
4. Does Snowflake support dimensional modeling?
Yes, Snowflake fully supports dimensional modeling for analytics and BI.
5. What are fact tables in Snowflake?
Fact tables store quantitative metrics like sales, revenue, or transactions.
6. What are dimension tables in Snowflake?
Dimension tables store descriptive data such as customer, product, or date information.
7. How do you design a Snowflake data model?
Design a Snowflake model by defining fact tables, normalizing dimensions, and setting relationships.
8. Is data modeling required for Snowflake?
Yes, data modeling is essential for organized, efficient, and accurate analytics.
9. What is Snowflake schema with example?
A Snowflake schema has a central fact table connected to normalized dimension tables, e.g., sales linked to product and customer tables.
10. Can beginners learn Snowflake data modeling?
Yes, beginners can learn Snowflake modeling with basic SQL and database concepts.
11. What tools are used for Snowflake data modeling?
Tools include ERwin, Lucidchart, dbt, and Snowflake Worksheets.
12. Is Snowflake data modeling asked in interviews?
Yes, questions often cover schemas, fact/dimension tables, and normalization.
13. What is the best schema for Snowflake?
Snowflake schema for large datasets, Star schema for fast reporting.
14. How long does it take to learn Snowflake modeling?
Basics take 1–2 weeks, intermediate 1–2 months, and advanced 3–6 months.
15. Does Snowflake replace traditional data warehouses?
Snowflake modernizes cloud data warehousing but doesn’t fully replace all traditional warehouses.